
If you want to reduce call wait times, start by comparing average speed of answer (ASA) with abandonment rate by queue and time interval. That comparison helps show whether the problem is a demand peak, misrouted calls, long conversations, or repeat contacts. Then test the smallest change that addresses the likely cause and track resolution quality alongside speed.
Key takeaways
- Average speed of answer measures how long answered callers wait in a queue before reaching an agent; it does not measure talk time.
- High ASA and high abandonment in the same queue and interval can signal a capacity or routing problem that needs prompt attention.
- Schedule adjustments, clearer routing, and accurate queue messages are practical first tests before investing in additional staff or replacing a phone system.
- Callbacks can reduce active hold time, but they need clear queue rules and enough capacity for return calls.
- Lower average handle time is not a win if first-call resolution falls and customers call again.
How do you diagnose what is making callers wait?
To find the cause of long call waits, compare ASA and abandonment by interval, queue, and call reason. Daily averages can hide a short but serious peak or one overloaded department, so use the smallest useful reporting period your system supports and check what its metrics include.
What do the main call center metrics mean?
ASA is the average time answered callers spend waiting in a queue before an agent picks up. It measures speed before the conversation, not hold time during the call. Call queue wait time is an individual caller’s time in the queue; report settings may treat menu navigation, callback requests, and abandoned calls differently.
Abandonment rate is the share of callers who hang up before reaching an agent. Service level is the share of calls answered within a chosen threshold, such as 80% within 30 seconds; the threshold is a team-defined goal, not a universal standard. Average handle time (AHT) is an agent’s average talk, hold, and after-call work time, while first-call resolution (FCR) is the share of issues resolved on the first contact.
Why should you segment ASA and abandonment?
Break both metrics down by 15- or 30-minute interval, queue, and call reason if your reports allow it. A daily ASA of 90 seconds could hide a 6-minute billing queue at lunchtime and a 20-second sales queue the rest of the day. Tag a sample of calls if your system does not report call reasons.
Check whether callers select the wrong menu option, transfer between departments, or call back about the same unresolved issue. A simple spreadsheet with interval, queue, call volume, ASA, abandoned calls, and top reason can give a small business enough evidence to choose its next step.
How do ASA and abandonment point to the likely constraint?
Use the pattern to form a hypothesis, then confirm it with call samples, schedules, or agent feedback. These are diagnostic clues, not proof: a promotion, outage, seasonal surge, or change in call mix can affect the same metrics.
| Pattern | Likely constraint | First check |
|---|---|---|
| High ASA, low abandonment | Callers tolerate the wait, but available capacity may be tight | Compare staffing and volume by interval; check AHT |
| High ASA, high abandonment | Waits are driving callers away, or callers cannot reach the right queue | Review peak coverage, menu choices, and routing |
| Low ASA, high abandonment | Some callers may hit the wrong queue, disconnect early, or face a poor menu experience | Sample abandoned calls and check menu exits |
| High AHT, repeat calls | Complex issues, missing context, or incomplete resolution | Review repeat reasons, transfers, and FCR |
| Uneven peaks, acceptable daily average | Schedules do not match when calls arrive | Compare call arrivals with breaks and shift coverage |
Benchmarks provide context, but they are not targets for every team. ContactBabel’s 2025 US survey guide reported a 99-second average speed to answer and 8.9% abandonment; it also described historical averages of 40–60 seconds and 5–6%. Those figures reflect survey results and can vary with industry, call mix, and measurement method. (ContactBabel’s 2025 US guide)
Which call wait time fix should you try first?
Choose a fix according to the evidence and the effort required to apply it. Start with changes you can pilot quickly, such as schedule adjustments or routing rules, then coordinate operational changes, and consider larger staffing or technology investments when the data shows simpler fixes will not address the constraint.
| Effort | Typical first moves | Likely impact when diagnosis fits |
|---|---|---|
| Low | Adjust schedules, clarify queue messages, fix obvious menu choices | Fast relief during predictable peaks or avoidable menu delays |
| Medium | Cross-train staff, set overflow rules, improve agent knowledge and callback procedures | Broader coverage or fewer repeat contacts |
| High | Add recurring staffing capacity or replace a phone setup that lacks needed controls | Can address sustained demand or capability gaps, with higher cost and coordination |
Impact depends on the cause. Adding agents will not fix a confusing menu that sends callers to the wrong team, while a better IVR will not solve a consistent shortage of coverage during known peaks.
What are 9 practical ways to reduce call wait times?
The most useful way to reduce call wait times is to match each fix to a measured queue problem. Use the signal below to decide whether a tactic fits, then monitor its listed metric alongside ASA and abandonment so a faster queue does not create unresolved work or an unsustainable load on agents.
1. Match schedules to peak call intervals
Signal: ASA and abandonment rise at the same times on comparable days. Compare call arrival reports with shifts, lunches, breaks, and opening hours. Move existing coverage toward predictable peaks and check the same intervals after the change. Effort: Low to medium. Monitor: ASA and abandonment by interval, plus agent workload.
2. Cross-train staff and plan overflow coverage
Signal: One queue backs up while agents with suitable skills are available elsewhere. Train a small group on common overflow call types and define when calls should move between queues. Set limits so overflow does not leave the original queue uncovered. Effort: Medium. Monitor: Transfers, ASA by queue, and resolution after transfer.
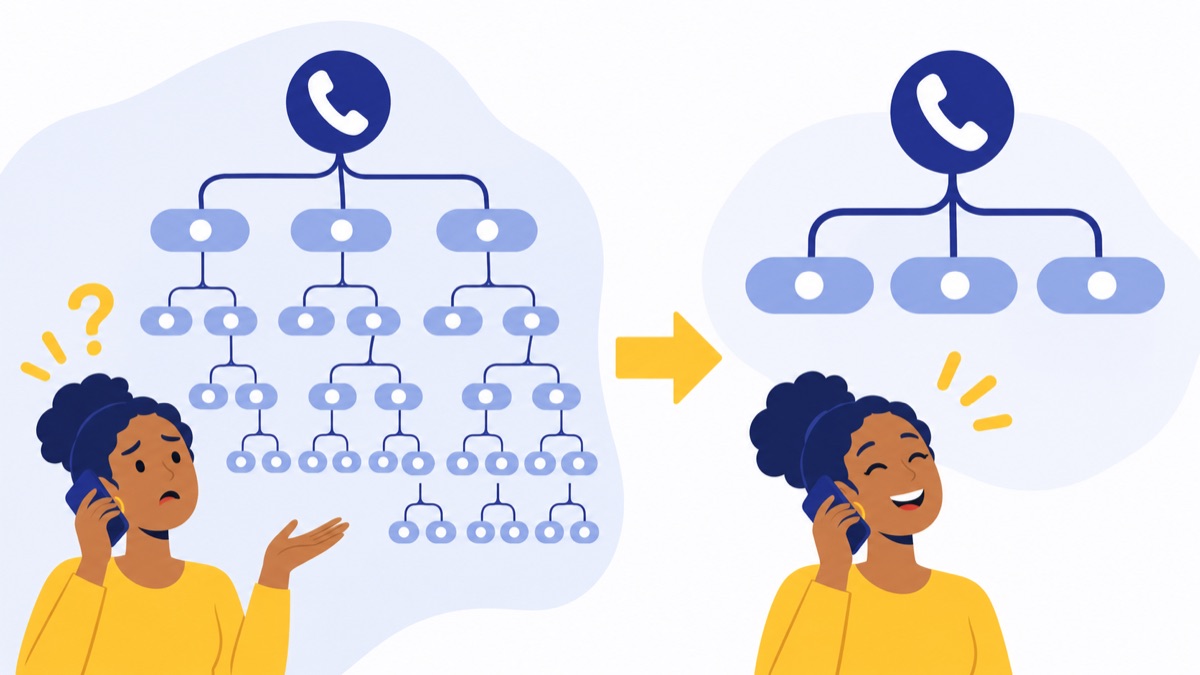
3. Simplify phone menus and route calls to the right queue
Signal: Callers transfer repeatedly, choose incorrect options, or abandon in the IVR. Review the most common call reasons, menu selections, and transfer paths. Remove redundant choices, use familiar language, and keep a clear route to a person. Skills-based call routing rules for small teams can help structure destinations around the help callers need.
A phone system with IVR menus and call routing can route calls based on menu choices and team rules. Effort: Low to high, depending on menu complexity. Monitor: Transfers, menu exits, ASA, and abandonment by call reason.
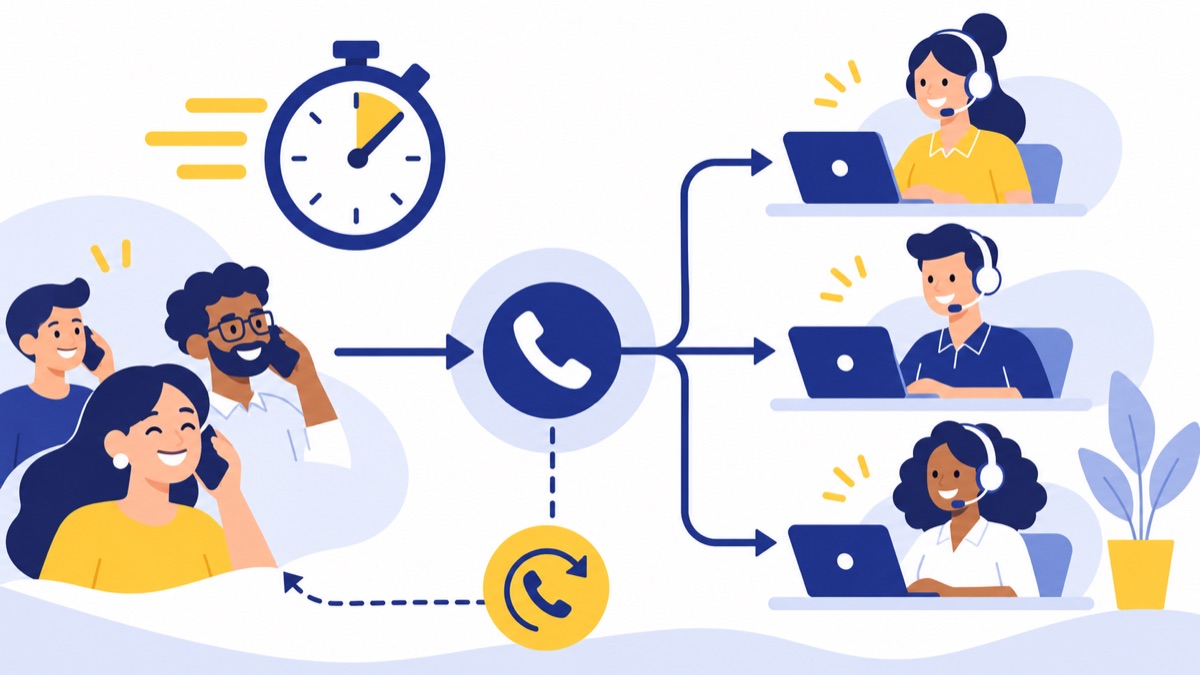
4. Offer callback instead of hold
Signal: Callers abandon during peak waits, and the team has enough capacity to return calls predictably. Offer a callback that preserves the caller’s place or clearly explains how the callback queue works. Give a realistic estimate, decide how to handle missed callbacks, and reserve capacity for return calls; callbacks can move work into another queue if capacity is missing.
A callback changes how a caller waits; it does not necessarily shorten the time until service. Track callback completion and missed attempts as well as queue ASA and abandonment. Effort: Medium to high. Monitor: Callback completion, time to callback, repeat attempts, and workload.
5. Remove repetitive calls with useful self-service
Signal: A recurring, simple call reason accounts for a meaningful share of volume. Publish a direct answer for tasks such as checking business hours, understanding a routine policy, or finding a form. Make the instructions easy to scan and keep an obvious way to reach an agent for exceptions or unresolved issues. Effort: Medium. Monitor: Calls for that reason, repeat contacts, and feedback about whether self-service worked.
6. Improve first-call resolution
Signal: Customers call back about the same issue, or calls involve avoidable transfers. Identify the top repeat reasons and give agents a clear process for resolving them on the first contact. Rising call duration can also contribute to longer waits when agents spend more time on calls, so track duration together with resolution. ContactBabel’s 2024 US guide reported FCR in the low-to-mid 70% range in its recent survey history and linked rising call duration with longer waits. (ContactBabel’s 2024 US guide) Effort: Medium. Monitor: FCR, repeat calls, transfers, and AHT.
7. Give agents the context and answers they need
Signal: Agents spend time searching for account details or asking customers to repeat information. Put relevant CRM records, recent interactions, and accurate procedures within easy reach. A HubSpot calling integration can make customer context available alongside calls when HubSpot is the team’s system of record.
Use call samples and agent feedback to find specific search delays; adding more documentation can make answers harder to find if it is poorly organized. Effort: Medium. Monitor: AHT, transfers, FCR, and agent feedback.
8. Reduce unnecessary after-call work without sacrificing accuracy
Signal: AHT is high because agents repeat manual notes or duplicate data entry after calls. Standardize required fields, remove redundant logging, and consider a reviewed call-summary workflow when it fits your process. AI call summaries may help draft notes, but agents should verify important details before saving them.
Effort: Medium. Monitor: After-call work time, note accuracy, AHT, and FCR. Do not set an AHT target in isolation: shorter calls can create repeat contacts if agents end conversations before resolving the problem.
9. Set clear expectations while callers wait
Signal: Callers hang up or repeatedly ask how long the queue will take. State what callers can do next, give an estimate only when it is based on current queue data, and explain callback availability or business hours accurately. Queue messages can improve clarity and reduce uncertainty, but they do not add capacity or make the underlying wait shorter. For practical examples, see call queue message scripts and timing.
Effort: Low. Monitor: Abandonment, callback selection, and caller feedback.
How do you test whether a change worked?
A change worked only if it improves the queue outcome without shifting the burden to unresolved repeat calls or overloaded agents. Set a baseline, pilot one major change for a defined period, and compare comparable days and intervals while tracking ASA, abandonment, FCR, customer feedback, and workload.
Set a baseline and run a small pilot
Record a representative set of comparable periods before changing a schedule, menu, or callback rule. Compare Monday mornings with Monday mornings, for example, rather than a quiet Friday with a busy Monday. Note unusual events such as outages, holidays, or campaigns that could distort the comparison.
Write down the hypothesis, the change, who owns it, and when you will review it. For a schedule pilot, that might be: “Move one trained agent to the 11 a.m.–1 p.m. peak for two weeks; compare ASA and abandonment in those intervals with the prior four comparable weeks.”
Track speed and quality together
Review ASA and abandonment alongside FCR, repeat contacts, transfers, customer feedback, and agent workload. A lower AHT can look good in a dashboard while customers call back because their issue was not resolved. If any quality measure worsens, inspect a sample of calls before expanding the change.
What common mistakes keep call queues long?
Some queue fixes make one dashboard number look better while leaving callers with the same problem elsewhere. Check whether a change shifts demand to another queue, creates repeat contacts, or asks agents to handle more work without enough capacity.
Relying on daily averages
A daily average can hide a sharp peak in one queue. Review interval-level data and the busiest call reasons before changing schedules or setting a service target.
Deflecting callers without a live-agent path
Self-service helps when it answers the caller’s question. If it does not, callers should be able to reach a person without starting over or navigating a loop.
Cutting handle time at the expense of resolution
A shorter conversation is not necessarily a better outcome. If AHT drops but FCR declines or repeat calls rise, adjust coaching and processes to restore resolution quality.
Offering callbacks without enough return-call capacity
Callbacks require a reliable process, enough staff to make them, and a plan for missed connections. Without those, the caller’s wait may become a missed callback followed by another attempt.
How can a small business build a queue improvement plan?
A small business can start with a spreadsheet, a few call samples, and a named owner for each pilot. Choose the highest-priority diagnosis, assign someone to make and review the change, and use phone-system reports to check whether callers and agents are better off after the pilot.
Use this checklist to get started:
- Pick one queue and review its ASA and abandonment by interval and call reason.
- Check schedules, transfers, repeat contacts, and a sample of abandoned calls.
- Name the likely constraint and choose one fix with a clear owner.
- Record a baseline and review date before the change.
- Compare similar periods and track speed, resolution, customer feedback, and workload together.
A cloud phone system can help teams manage menus, routing, queues, reporting, call summaries, and CRM context in one workflow. Voicalyst’s virtual phone system and HubSpot calling integration are relevant options for teams that need those capabilities; the right fit depends on the queue problem you have identified. Explore Voicalyst for support teams.
Frequently Asked Questions
What is a good average speed of answer for a call center?
There is no universal good average speed of answer (ASA): the right target depends on call urgency, customer expectations, staffing, and how your team measures the queue. ContactBabel reported a 99-second US survey average in its 2025 guide, but that is a benchmark, not a service target. Compare ASA with abandonment, resolution, and customer feedback for your own queues.
How is average speed of answer calculated?
Average speed of answer is the average time callers wait in a queue before an agent answers. A common calculation is total wait time for answered calls divided by the number of answered calls during the period. Confirm whether your phone system excludes callers who abandon, callbacks, or time spent navigating menus; different definitions can make reports hard to compare.
Does offering a callback reduce call wait times?
A callback can reduce the time a caller spends actively holding, but it does not automatically reduce the underlying queue delay. It works best when the system preserves queue position, estimates timing accurately, and has capacity for return calls. Track callback completion, missed callbacks, ASA, abandonment, and agent workload to confirm the option improves the experience.
How can I reduce call handling time without hurting customer service?
Reduce avoidable work around the conversation: show agents relevant customer context, make accurate answers easy to find, simplify documentation, and automate reliable summaries where appropriate. Keep resolution quality in view. If average handle time falls while repeat calls rise or first-call resolution drops, the team may be ending calls sooner without solving the customer’s problem.